R, Shiny, Rmarkdown Dashboard Tutorial with Cryptocurrency Data Example

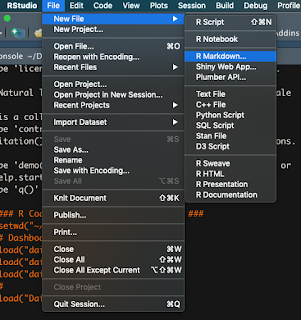
This post is intended for those with some exposure to R and shiny. If you are brand new to Shiny or Rmarkdown, then you may want to review this post before proceeding onward. I'll address the following: Loading and using data in your document Adjusting margins in your shiny document. Margins are by default set at a specific width for all shiny documents. Provide example code for R, Rshiny, Rmarkdown dashboard. Includes two selector inputs, one to choose which column of the daily trading data to use and the other to select which cryptocurrencies to plot. date range input render table with correlation matrix render line graph with options to select which cryptocurrencies to graph. On my last post I gave an explanation of the tutorial code that appears when you open a new Rmarkdown document. This time I built a small dashboard with online cryptocurrency trading data. I pulled this data from this webpage which has all sorts of cyrpto trading data. I used the three daily...
