Network Analysis in R: Visualizing Network Dynamics

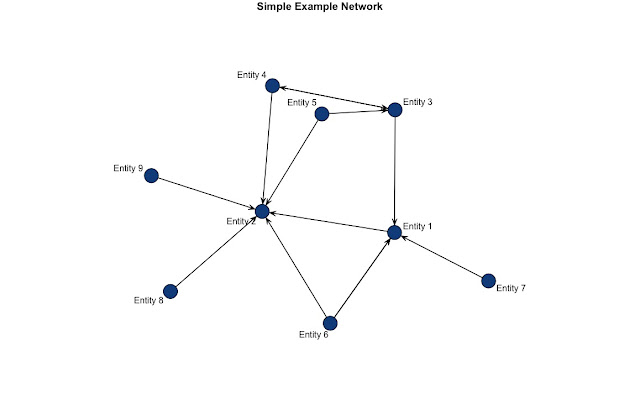
Network analysis is just a moniker for graphically describing network relationships. Whether you are a health official trying to describe the spread of communicable diseases or a business analyst describing the progress of a sales campaign or incentive, network analysis helps others view and better understand a network dynamic. You will need to download the 'network' package for this. In this post I will be doing the following: Provide a simple made up example to understand what network analysis is. Expand upon the simple example by adding hyper edges, different shapes and colors, and changing labels for vertices and edges to convey additional information. Provide R code with explanations of how to generate these graphics. Let's begin with a quick example so it is clear what network analysis is. At its simplest, a network analysis is a graphical depiction of the movement of some unit among various entities. In the above graphic, I have nine entities with the arr...