Posts

Showing posts from August, 2019

Learn to Code in R: Reading in External Data Files
Image
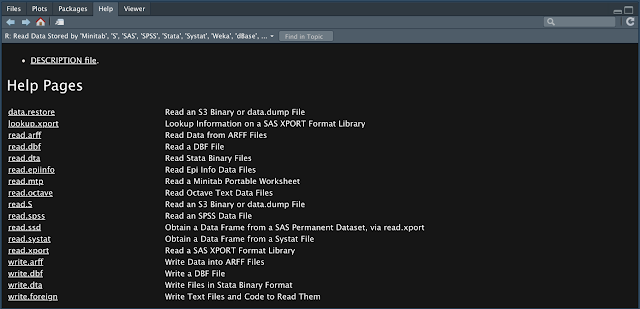
One skill that everyone in R should have is how to read in external data files. Many people who have some exposure to R will have some familiarity with this skill, but little knowledge of the many formats R can handle. This is often because many people's exposure is from a singular class or a project they did once. My hope is to provide the reader with a broader understanding of R's ability to handle a number of data formats. In this post, I will cover, How to read in .csv, Stata, SPSS, SAS, and Excel spreadsheet files. Some formatting options and different abilities you ought to know. Some explanations regarding help documentation and using function arguments/options. Saving and loading Rdata files for minimal hassle once the data is just the way you want it. Reading in Text Files and Function Options The basic function for reading in data is read.table() . I mention this one first because the other functions for reading in external data are based off of this one. In

Online Statistics Tutor: Analyzing Nominal and Ordinal Data

Image
While nominal (categorical) and ordinal (rank order) data can't be used in standard introductory analyses, like  the T or F-tests, there still is a number of options when working with these kinds of data.  In this post I will point out a few of these, specifically, Producing table of counts of cross-tabs.  Chi-square test of association. Kruskall's Gamma: A correlation coefficient for ordinal data. I will provide code on how to perform each in R Let's first start with producing count tables in R. This is the most basic way to summarize nominal or ordinal data. In the code below, I've created a couple sets of nominal and ordinal values containing all available values and then sampled from them. The output from sampling from the set of 4 colors and 5 items in a likert scale are saved as "colset" and "ordset". The size argument in the sample function means that this output will be 100 elements long. To produce a table of counts for these da

Learn to Code in R: for Loops and tapply, lapply, and sapply.

Image
Continuing on with the discussion of for loops and apply functions bring us to another set of apply functions used to, well, apply a function to data in different ways. In this post, I will be: Discussing the arrays or data arrangements for which the different apply functions are designed. That is, when to use each one. Comparing for loops to tapply, lapply, and sapply. I will write for loops for each so you can better familiarize yourself with for loops and situations where you can use the apply functions, instead. The data I will be using for this is the same data set that I used for the apply function post . This is some code I used to prepare the data to get it to its current state. Some of which I will be discussing later. I mostly provide this for the sake of disclosure and clarity. lapply and sapply: Apply a function over a Vector or List This is the most apparent and obvious replacement to a for loop. You give lapply the information set that you wish to iterat