Online Statistics Tutor: Z-scores & Normal Probabilities
During my days of teaching introductory statistics, students were often looking for additional resources to help them master the material. My hope is for this post to supplement and aid students who are being introduced to statistics, or anyone looking for refresher material.
That being said, if there is a specific topic that you would like me to cover that is not found here, please mention this in the comments and I will do my best to produce a lesson for it.
That being said, if there is a specific topic that you would like me to cover that is not found here, please mention this in the comments and I will do my best to produce a lesson for it.
Normal Probability
Normal probability is referring to making inference (coming to a conclusion and generalizing that conclusion to a population) about the likelihood of an event based upon the assumption the outcome is normally distributed. In short, assume normally distributed data in order to make inference.
For example, let's assume human height is normally distributed. How likely is it that a man is over 5 feet 10 inches (70 in)? Let's say the population has a mean of 68 inches with a standard deviation of 4 in. (I made these numbers up). We would conclude that there is an approximate probability of 0.31 that a man is taller than 5' 10''. How did we reach that conclusion? I compared that score (70 in.) to a normal distribution with a mean equal to 68, and standard deviation of 4.
Most introductory statistics courses will start you out with z-scores and then compare that z-score to the standard normal distribution (mean = 0, and sd=1). I will cover that approach as well as a more direct approach that can be done using statistical software. The software I will be using is free and you can download it here.
Z-Scores
Let's start out discussing what a z-score is. A "z-score" is just jargon for a standardized score. "Standardized" in this case, is referring to a score that is centered around the mean and scaled by the standard deviation. We can interpret z-scores in terms of standard deviations. For example, a z-score of 1.5 can be interpreted as a score 1.5 standard deviations above the mean. A z-score of -2.14 can be interpreted as a score 2.14 standard deviations below the mean.
Why use z-scores? Calculating a z-score or standardizing a metric is a good way to take data that may come from different metrics (e.g. inches vs. centimeters) and placing them on the same scale. Using standardized scores allows us to compare human height in Europe to height in the USA. Or we could compare scores from the ACT exam to those from the SAT exam (college admission exams). Is an ACT score of 24 better than an SAT score of 600? We'll need to standardize those scores according to their respective populations to find out.
The formula to calculate a z-score is straight forward.
z=(x-𝛍)/𝛔
z is the z-score, x is your data point you are trying to standardize, 𝛍 (mu) represents the population mean, and 𝛔 (sigma) represents the population standard deviation.
z = (x - 𝛍) / 𝛔.
z = (174 - 167.5) / 7.5
= 6.5 / 7.5
= 0.86667
This score is 0.333 standard deviations above the mean. For our individual from the USA we have,
z = (x - 𝛍) / 𝛔.
z = (70 - 68) / 4
= 2/4
= 0.5
This person is 0.5 standard deviations above the mean. Because 0.86667 > 0.5, that means the UK person is a relatively taller individual compared to their population. FYI, 1 inch = 2.54 centimeters. 174 cm ≈ 68.5 in. Converting cm to inches could help compare the literal heights of the two individuals but it won't save you work because you still need to standardize the heights by their respective populations.
Can you answer the question, is an ACT score of 24 better than an SAT score of 600 on your own? That is, compare the z-scores for the ACT and SAT scores.
which gives also gives us 0.7257. Why is this the same? Because we are doing the same thing, we're just using the distribution of the raw ACT scores.
What if we wanted to know the probability of an ACT score greater than 29? Using our two methods we would get the following.
That concludes this online statistics tutor lesson. I hope this has been helpful to you in your studies. Again, if you have any requests for topics, please request that in the comments.
You are welcome to ask me specific questions that you may have regarding this material from this site. In the interest of full disclosure, there is a nominal $1.50 fee to submit questions. That is because it takes time and effort to respond to your questions.
Thanks!
For example, let's assume human height is normally distributed. How likely is it that a man is over 5 feet 10 inches (70 in)? Let's say the population has a mean of 68 inches with a standard deviation of 4 in. (I made these numbers up). We would conclude that there is an approximate probability of 0.31 that a man is taller than 5' 10''. How did we reach that conclusion? I compared that score (70 in.) to a normal distribution with a mean equal to 68, and standard deviation of 4.
Most introductory statistics courses will start you out with z-scores and then compare that z-score to the standard normal distribution (mean = 0, and sd=1). I will cover that approach as well as a more direct approach that can be done using statistical software. The software I will be using is free and you can download it here.
Z-Scores
Let's start out discussing what a z-score is. A "z-score" is just jargon for a standardized score. "Standardized" in this case, is referring to a score that is centered around the mean and scaled by the standard deviation. We can interpret z-scores in terms of standard deviations. For example, a z-score of 1.5 can be interpreted as a score 1.5 standard deviations above the mean. A z-score of -2.14 can be interpreted as a score 2.14 standard deviations below the mean.
Why use z-scores? Calculating a z-score or standardizing a metric is a good way to take data that may come from different metrics (e.g. inches vs. centimeters) and placing them on the same scale. Using standardized scores allows us to compare human height in Europe to height in the USA. Or we could compare scores from the ACT exam to those from the SAT exam (college admission exams). Is an ACT score of 24 better than an SAT score of 600? We'll need to standardize those scores according to their respective populations to find out.
The formula to calculate a z-score is straight forward.
z=(x-𝛍)/𝛔
z is the z-score, x is your data point you are trying to standardize, 𝛍 (mu) represents the population mean, and 𝛔 (sigma) represents the population standard deviation.
Example Z-score Problems
To calculate a z-score we need the mean and standard deviation of a population. For the following examples, we have the information below. These numbers are made up, by the way, and are just for demonstrative purposes.- SAT mean = 550, sd = 120. ACT mean = 21, sd = 5.
- UK height mean = 167.5 cm and sd =7.5 cm. USA height mean = 68 in., and sd = 4 in.
- We have one person who is 70 in. tall and comes from a population with mean = 68, and sd= 4.
- We have another person who is 170 cm tall and comes from a population with mean = 167.5, and sd = 7.5.
- We are being asked which individual is relatively taller compared to their population. This question is asking us to compare z-scores.
z = (x - 𝛍) / 𝛔.
z = (174 - 167.5) / 7.5
= 6.5 / 7.5
= 0.86667
This score is 0.333 standard deviations above the mean. For our individual from the USA we have,
z = (x - 𝛍) / 𝛔.
z = (70 - 68) / 4
= 2/4
= 0.5
This person is 0.5 standard deviations above the mean. Because 0.86667 > 0.5, that means the UK person is a relatively taller individual compared to their population. FYI, 1 inch = 2.54 centimeters. 174 cm ≈ 68.5 in. Converting cm to inches could help compare the literal heights of the two individuals but it won't save you work because you still need to standardize the heights by their respective populations.
Can you answer the question, is an ACT score of 24 better than an SAT score of 600 on your own? That is, compare the z-scores for the ACT and SAT scores.
Normal Probabilities
Using Z-scores
Normal probability problems will ask you the likelihood of finding values greater or less than some comparison value. For example, we started this lesson asking how likely is it to find a person over 70 inches tall.
To make inference regarding a population we need to compare our z-score to a normal distribution. Most introductory stats classes will provide you with some kind of z-table like this. Here you will find the probability by mapping your calculated z-score to the corresponding row and column of the table. This table gives you the area underneath the bell curve from the lower end to your z-score. This will give you the probability of values less than your z-score. To get the probability of values greater than your z-score, subtract one minus your z-table probability. This may make more sense depicted visually, so let's do an example and visualize what are trying to find.
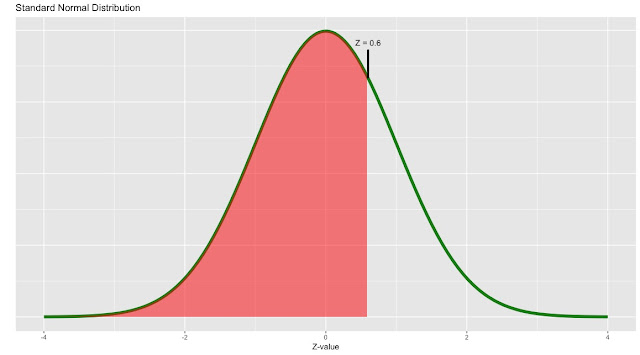
Continuing with the ACT and SAT scores, what is the probability that a randomly selected person scores a 24 or less on the ACT. First let's calculate the z-score.
z = (24 - 21) / 5
= 3 / 5
= 0.6
We use the z-table to find the area below the curve where z is less than 0.6. We are using mean = 0 and sd = 1 because calculating a z-score maps our data point to a standard normal distribution.
Referring to our z-table, the area underneath to curve is 0.7257, meaning there is a 0.7257 probability that a randomly selected individual would have a ACT score of 24 or less.
Using Statistical Software (R)
We can use the software to produce the area underneath the curve without having to calculate a z-score. We just need to tell R, the statistical software package, what the mean and standard deviation are.
In the R console we can use,
pnorm(24,21,5),
What if we wanted to know the probability of an ACT score greater than 29? Using our two methods we would get the following.
- Using Z-score and Z-table: z = (29 - 21) / 5 = 1.6. Now use one minus z-table prob give us p = 0.0548.
- Using R: 1-pnorm(29,21,5). Gives us p = 0.05479929. Round that to 4 decimal places and it is the same.
That concludes this online statistics tutor lesson. I hope this has been helpful to you in your studies. Again, if you have any requests for topics, please request that in the comments.
You are welcome to ask me specific questions that you may have regarding this material from this site. In the interest of full disclosure, there is a nominal $1.50 fee to submit questions. That is because it takes time and effort to respond to your questions.
Thanks!


Comments
Post a Comment